How to Build an AI Ticket Routing Quality Dashboard
Build a production dashboard that connects routing health, policy actions, corrections, operational impact, and event-level evidence.
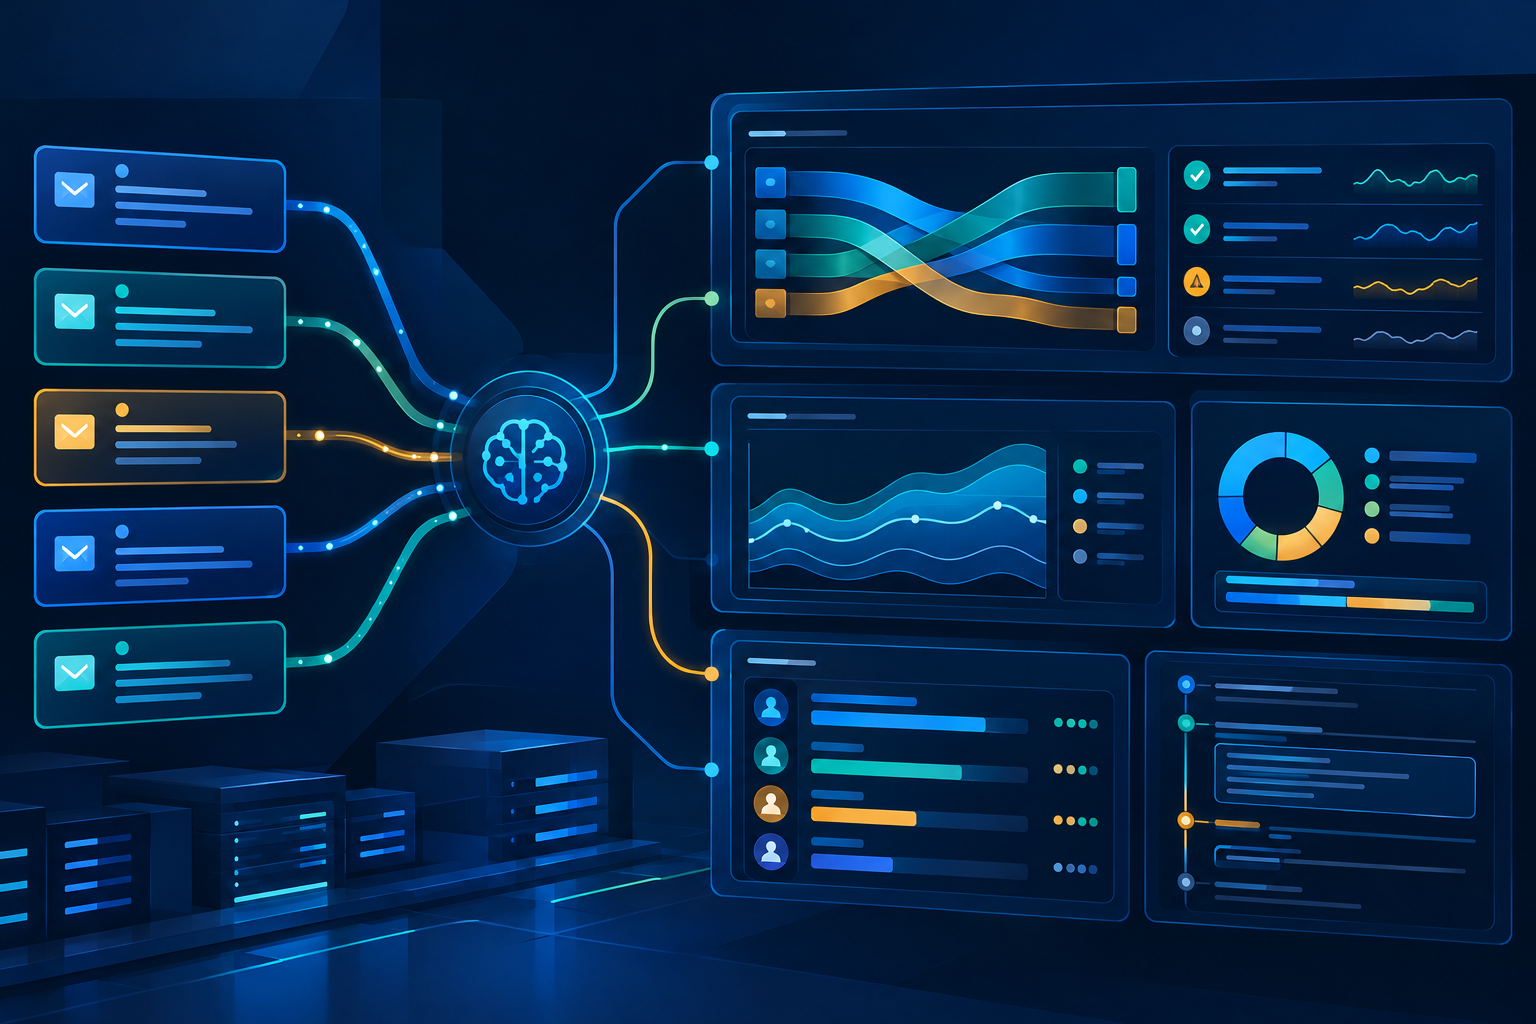
An AI ticket routing dashboard should do more than display ticket volume and average confidence. It should help an operator find unsafe assignments, distinguish real misroutes from normal handoffs, and trace a change back to the intake, definition, recommendation, policy, or queue mapping that caused it.
This guide turns the broader AI ticket routing observability framework into a dashboard that service desk operators can use. It fits within the operating model in the AI ticket triage guide and can use decision data produced by Layer8 Triage.
Define the dashboard's decisions
Before selecting charts, write down the questions the dashboard must answer.
A production routing dashboard should support at least five decisions:
1. Is the routing workflow operating?
2. Is automatic assignment staying inside approved safety boundaries?
3. Which resolver groups or ticket segments are changing?
4. What caused a correction or fallback?
5. Does an operator need to contain, investigate, or simply observe the condition?
These questions determine the data and drill-down paths. A panel that cannot change an operational decision is likely background reporting rather than a primary control.
Assign a named audience to each view. A shift lead needs immediate failures and queue movement. A routing owner needs boundary quality and correction causes. A service owner needs traffic and ownership changes for a particular group. Executives usually need trends and material exceptions, not event-level diagnostic detail.
Create one decision-level dataset
Build the dashboard from routing decisions, not only current ticket state. Current state loses the sequence that explains how a ticket arrived at its owner.
Use one record per routing attempt with:
- Ticket and routing event identifiers
- Event time and intake channel
- Requested service and category when available
- Recommended resolver group
- Confidence value and band
- Policy action
- Final accepted owner
- Correction reason
- Definition, policy, and recommendation versions
- Missing-context indicators
- Queue mapping result
- Automatic, reviewed, fallback, hold, block, or failure state
Keep ticket creation time separate from routing time and correction time. This allows operators to distinguish intake delay from routing delay and downstream queue delay.
If a ticket is evaluated more than once, retain each event. Overwriting the first recommendation with the latest result makes a repeated routing loop look like a single successful decision.
Define labels before calculating quality
A useful dashboard depends on consistent outcome labels.
Do not count every reassignment as a misroute. Create explicit categories such as:
- Confirmed incorrect initial owner
- Correct initial owner with fulfillment handoff
- Capacity or workload transfer
- Organizational ownership change
- Duplicate or merged ticket
- Review recommendation rejected
- Ownership unresolved
Only confirmed incorrect ownership should feed the primary misroute measure. Display unresolved cases separately so uncertainty remains visible.
The audit workflow in How to Audit AI Ticket Misroutes and Build a Triage Feedback Loop provides a practical structure for reviewing and labeling those events. Resolver-group boundaries should also follow a shared schema such as the one in How to Write Resolver-Group Definitions for AI Ticket Routing.
Build the dashboard in layers
A useful production dashboard moves from operational status to segmented quality and then to event evidence.
Layer 1: workflow health
Place immediate operating conditions at the top:
- Routing attempts and completed actions
- Failures and timeouts
- Tickets left without an owner
- Invalid or inactive queue destinations
- Fallback volume
- Holds for missing context
- Event-ingestion delay
Show counts and rates together. Ten failures in ten attempts and ten failures in ten thousand attempts require different responses, while both counts still matter.
Include the last successful event time for each integration. A flat quality metric may mean stable performance, or it may mean data stopped arriving.
Layer 2: action mix
Show how eligible tickets moved through policy:
- Automatic assignment
- Assisted review
- Fallback
- Clarification hold
- Policy block
- Technical failure
Break the action mix down by category, group, channel, and confidence band. This view reveals policy behavior that recommendation-only measures miss.
For example, accepted recommendations can remain stable while a missing-context gate sends twice as many tickets to review. The recommendation layer did not necessarily degrade; intake or enrichment may have changed.
Layer 3: routing quality
Display:
- Confirmed misroutes among reviewed outcomes
- Accepted recommendations
- High-confidence corrections
- Harmful automatic assignments
- Corrections by adjacent group pair
- Repeat reassignment before accepted ownership
- Tickets returned to the original queue
Always show the reviewed denominator. A quality rate based on a small or biased review sample should not be presented as if it covers all traffic.
Confidence should be segmented rather than averaged. An overall average can stay unchanged while the high-confidence band accumulates harmful errors.
Layer 4: operational impact
Connect routing behavior to:
- Time from intake to accepted owner
- Time in review or fallback
- Reassignments before ownership
- Queue volume changes
- Review workload
- Tickets unassigned beyond the team's operating limit
Present these as associated outcomes, not automatic proof that routing caused a change. Staffing, incident traffic, and process changes can affect the same measures.
Layer 5: event investigation
Every aggregate panel should lead to the event set behind it. The detail view should contain the evidence available at decision time, the recommendation, policy action, configuration versions, correction history, and a standard cause label.
Redact or restrict sensitive content. Most viewers need the deciding fields and extracted evidence, not unrestricted ticket bodies.
Use filters that mirror operational boundaries
At minimum, provide filters for:
- Time window
- Resolver group
- Adjacent group pair
- Category and requested service
- Intake channel
- Confidence band
- Automatic versus reviewed action
- Definition and policy version
- Missing-context state
- Correction reason
Preserve filters when an operator drills into events. If a panel shows high-confidence corrections for Identity Operations after a definition release, the event list should retain all three conditions.
Add a comparison mode for current versus prior version or current versus baseline period. A raw value answers what is happening; a comparison helps answer what changed.
Design metric cards with context
Each primary card should contain:
- Current count or rate
- Denominator
- Comparison period or baseline
- Direction and size of change
- Data freshness
- Link to the underlying events
- Owner or runbook when action may be required
Avoid red, yellow, and green status without a defined meaning. A red card should correspond to an operational threshold, safety invariant, or service objective. Color is not a substitute for the condition.
For low-volume segments, prefer counts and review status over volatile percentages. A single correction can produce a dramatic rate movement without establishing a durable trend.
Add release annotations
Routing behavior changes when teams edit definitions, thresholds, exclusions, mappings, intake fields, or enrichment.
Annotate the timeline with:
- Release time
- Configuration version
- Affected groups and categories
- Expected behavior change
- Approver
- Rollback reference
These annotations let reviewers compare a metric shift with an actual production change. They also reduce the chance that a planned queue movement is treated as unexplained drift.
The confidence-based AI ticket triage governance framework explains why confidence and policy gates should be reviewed together. The dashboard should expose both.
Build the drill-down sequence
When an operator sees a changed metric, the dashboard should support this path:
1. Select the affected time window.
2. Segment by action, resolver group, category, channel, and version.
3. Compare automatic and reviewed outcomes.
4. Open the changed event set.
5. Inspect decision evidence and correction reasons.
6. Group findings by responsible layer.
7. Link the investigation to containment or a backlog item.
This sequence keeps investigation attached to evidence. It also avoids a common failure mode: changing an auto-routing threshold because a chart moved before determining why it moved.
If the condition needs active notification, use the companion guide on how to set alerts for AI ticket routing drift. Dashboards explain; alerts summon an owner.
Example dashboard investigation
A dashboard shows that fallback volume increased after a portal release. Overall ticket volume and recommendation acceptance are stable.
The operator filters to the new portal channel and finds that most fallback events involve software-access requests. The event detail shows that the prior form supplied application name as a required field, while the new form submits a free-text description without the structured value. Policy correctly blocks automatic routing when application name is missing.
The dashboard leads to the correct response:
- Keep the safety gate in place
- Restore the required application field
- Backfill context for waiting tickets where possible
- Monitor fallback volume after the form fix
- Add intake-field presence to release testing
Lowering the confidence threshold would not fix the missing context. The layered dashboard makes that distinction visible.
Validate the dashboard before relying on it
Test the dashboard as an operational control.
Reconcile event counts
Compare routing attempts, workflow actions, and ticket-system records for the same period. Explain duplicates, retries, delayed events, and exclusions.
Test known cases
Create or identify examples for automatic assignment, human review, fallback, missing context, invalid destination, correction, and fulfillment handoff. Confirm each appears in the correct panel and event view.
Verify version joins
Ensure every routing event resolves to the definition and policy version active at decision time. A current-version join can rewrite historical interpretation.
Check access and retention
Confirm that viewers only see permitted ticket evidence and that retention matches organizational policy.
Exercise stale-data behavior
Stop or delay a test event stream. The dashboard should show data freshness failure instead of displaying old values as current.
Review with operators
Ask shift leads and routing owners to investigate a seeded issue using only the dashboard. Missing filters, unclear labels, and broken drill-down paths become obvious during a real task.
Keep the dashboard maintainable
Assign owners for the dataset, metric definitions, visual components, and correction taxonomy. Review them when queue structure or routing policy changes.
Retire panels that no longer support a decision. Add new segmentation when a service launch or ownership boundary creates a new risk. Keep metric definitions close to the dashboard so viewers know exactly what a count includes.
Layer8 Triage can supply structured recommendations and controlled routing actions, but the dashboard should preserve the organization's own ownership model, review labels, and operating limits.
Conclusion
An AI ticket routing quality dashboard should move from workflow health to action mix, routing quality, operational impact, and event evidence. Its value comes from the investigation path, not the number of charts.
Build it on decision-level events, define correction labels before calculating quality, show denominators and freshness, annotate releases, and preserve filters into event review. Operators can then distinguish a recommendation problem from an intake, policy, mapping, or workflow problem and respond at the right layer.
<!-- zero-content-links:start -->
Related Layer8 Labs guides
- AI Ticket Routing Incident Response: A Practical Operating Framework
- How to Conduct an AI Ticket Routing Post-Incident Review
- Explore Layer8 Triage
<!-- zero-content-links:end -->